Debugging JavaScript (without console.log)
Translated from the Portuguese original.Read the original
In this article
That's right: if you use console.log to debug your JavaScript web app, you're most likely wasting a ton of time on the whole process.
I'll admit I spent more than 3 years working only on backend applications (Java, Ruby and Python), and just a few months ago I came back to the frontend world (more specifically, ReactJS).
Modern browsers (like Chrome and Firefox) offer amazing tools that make developers' lives easier, so why do we keep repeating bad habits like using console.log to debug our JavaScript code?
The problem with using console
I don't want to be extreme and say you shouldn't use the famous console, but going back and forth to your IDE to add/remove them wastes a ton of time.
On top of that, to debug an app you need to know which part of the code the problem is probably in, and so we almost always end up cluttering our code with console.log (Think about it: have you ever made a commit and forgotten to remove them?), which even makes the output hard to read in your browser's console.
If you're still not convinced there might be better ways to debug a JavaScript app, take a few minutes to think about the process you currently use to debug code. Most likely it looks a lot like the one described above.
What are Developer Tools?
As I said at the start of the article, modern browsers (like Chrome and Firefox) offer the famous Developer Tools, and in this article we'll use Firefox's. If you use another browser like Chrome, don't worry: these tools are very similar and the way you debug is pretty much the same (except for a few names that change).
Firefox Developer Tools
For this article, we'll use the TODOs app built with React. Open the app and spend a little time playing with it to understand how it works.
Great, now that you know the app, let's debug it using our Developer Tools.
With the page open, press the shortcut Ctrl + Shift + S (on OSX Command + Option + S) or go to the menu -> Tools -> Web Developer -> Debugger.
https://www.youtube.com/watch?v=yI5SlVQiZtI
A screen similar to the following will open:
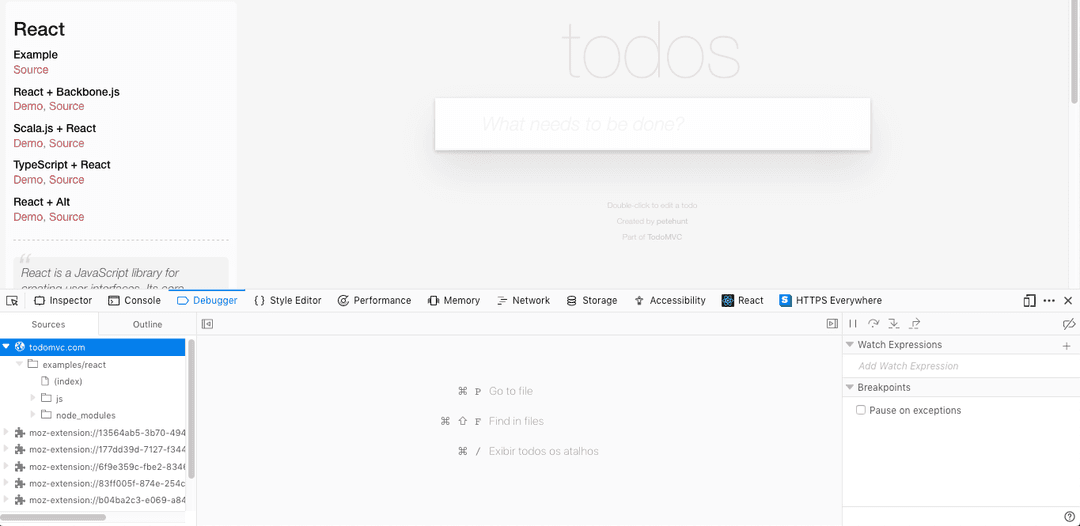
Figure 1: Firefox Developer Tools open
On the left, under Sources, you'll see a list of scripts loaded on the page, grouped by domain. Under Outline, you'll see a list of functions in the open file.
Try going to -> todomvc.com -> examples/react -> js and click on the file todoModel.js
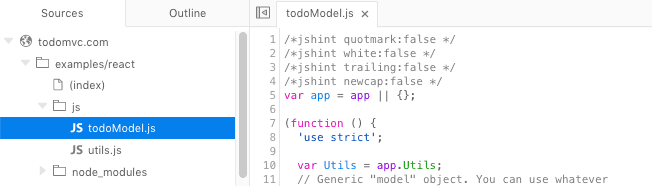
Figure 2: The todoModel.js file open in Firefox Developer Tools
With the file open, you can add breakpoints like in any other IDE. To add a breakpoint, just click any line number.
Let's add one on line 32 in the addTodo function (shortcut Ctrl + B or Command + B on OSX). This means that every time this line runs, execution will pause, and with that pause you can see which variable values are being passed or even go line by line to understand the flow or where the code is broken.
Add the breakpoint and, in the app, add a todo and press enter:
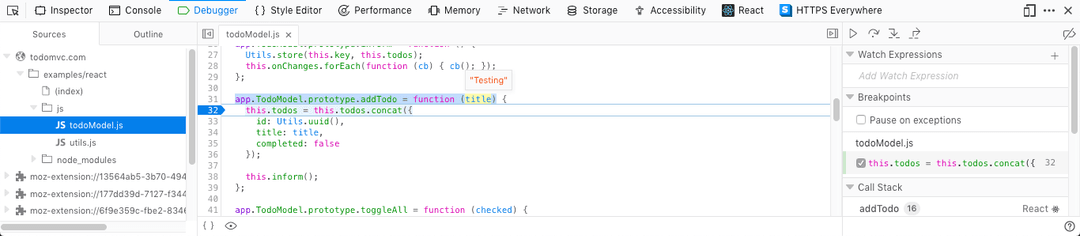
Figure 3: Debugger paused on line 32 of the todoModel.js file open in Firefox Developer Tools
At this point, you'll have the following options:
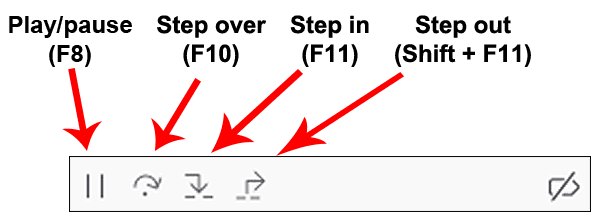
Figure 4: Firefox Developer Tools Debug shortcuts - Courtesy: https://developer.mozilla.org/en-US/docs/Tools/Debugger/How_to/Step_through_code
Pause/Resume (shortcut F8): As the name says, it pauses or moves on to the next breakpoint.
Step Over (shortcut F10): Step by step, you go through the current function line by line.
Step In (shortcut F11): Goes to the next line of the function; if it's a call to another function, it steps into it.
Step Out (shortcut ⇧ + F11): Goes to the end of the function.
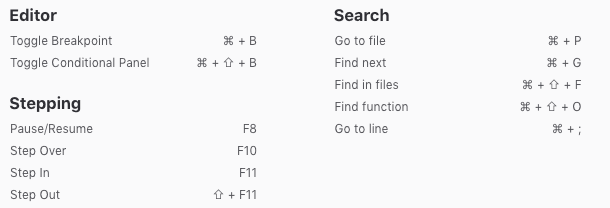
Figure 5: Firefox Developer Tools shortcuts
You can also add conditional breakpoints, meaning that if a condition is met, execution will pause at the point you set.
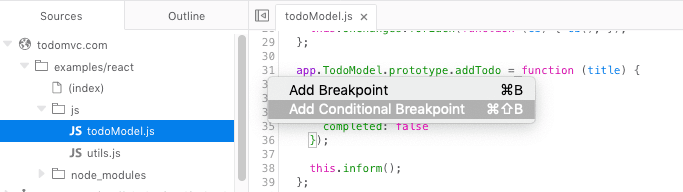
Figure 6: Adding a Conditional Breakpoint in Firefox Developer Tools

Figure 7: Conditional Breakpoint in Firefox Developer Tools
Conclusion
The goal of this article was just to introduce this powerful tool and give you the option to try it out and decide for yourself whether you should keep using console.log, or even which tool fits best in which situation.
If you want to dig deeper into Firefox's developer tools, I recommend reading the official documentation. There, besides going deeper into the Debug tab, you'll learn about other super important ones, like Inspector, Console and Network, among others.